In this post, we will use R shiny application developed by Shao et al. (1), to annotate transcriptional units in the data. The code for this app is available at TU_filter
The app essentially performs the following steps:
1) binning the genome into 200 bases bins,
2) calculate the strand-specific coverage,
3) divide genome into “transcribed” (transcription units, ThUs) and “not-transcribed” regions using GenoSTAN package,
4) join the resulting TUs by exons (coding regions), assume the rest as ncRNAs.
Inputs:
1) reference genome in gtf format - here I used mm10 latest realease from gencode
2) bam files
Output:
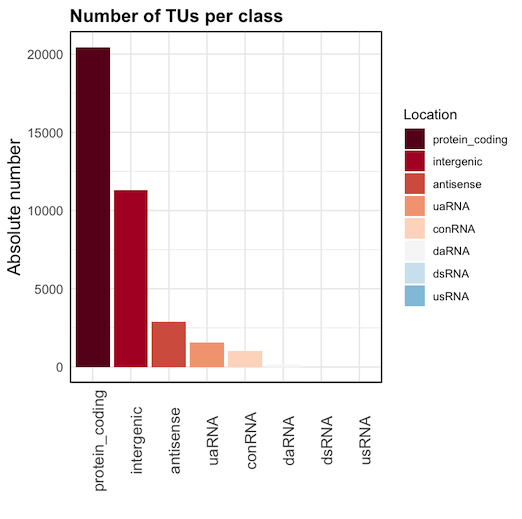
1) a graph with number of TUs per class
2) gff3 file with TU intervals
References
- Distinct transcription kinetics of pluripotent cell states. Rui Shao, Banushree Kumar, Katja Lidschreiber, Michael Lidschreiber, Patrick Cramer, Simon J Elsässer. Molecular Systems Biology (2022)18:e10407